Survey Instrument
From: Masnick M et al. Improving Understanding of Publicly Reported Healthcare-Associated Infection (HAI) Data.
This is the final version of the survey instrument used in the manuscript cited above.
Patients were randomly assigned to one of two arms: (1) the new presentation method; (2) the existing "detailed" presentation method from CMS Hospital Compare.
The same underlying data is used for both arms; only the presentation method differs. Questions are presented in the same order for both arms.
Each question asked participants to select one possible answer from a list of options. The options were the same for all questions across both arms.
Survey contents
The survey instrument was divided into 3 sections:-
Eligibility assessment and introduction
This section was identical to the survey instrument used in a prior study. We have provided a PDF of the relevant pages here.
-
Hospital comparison questions
See below.
-
Use/utility of hospital comparison website and demographics questions
Again, this section was identical to the survey instrument used in a prior study. We have provided a PDF of the relevant pages here.
2) Hospital comparison survey questions
The survey questions for both arms follow below.
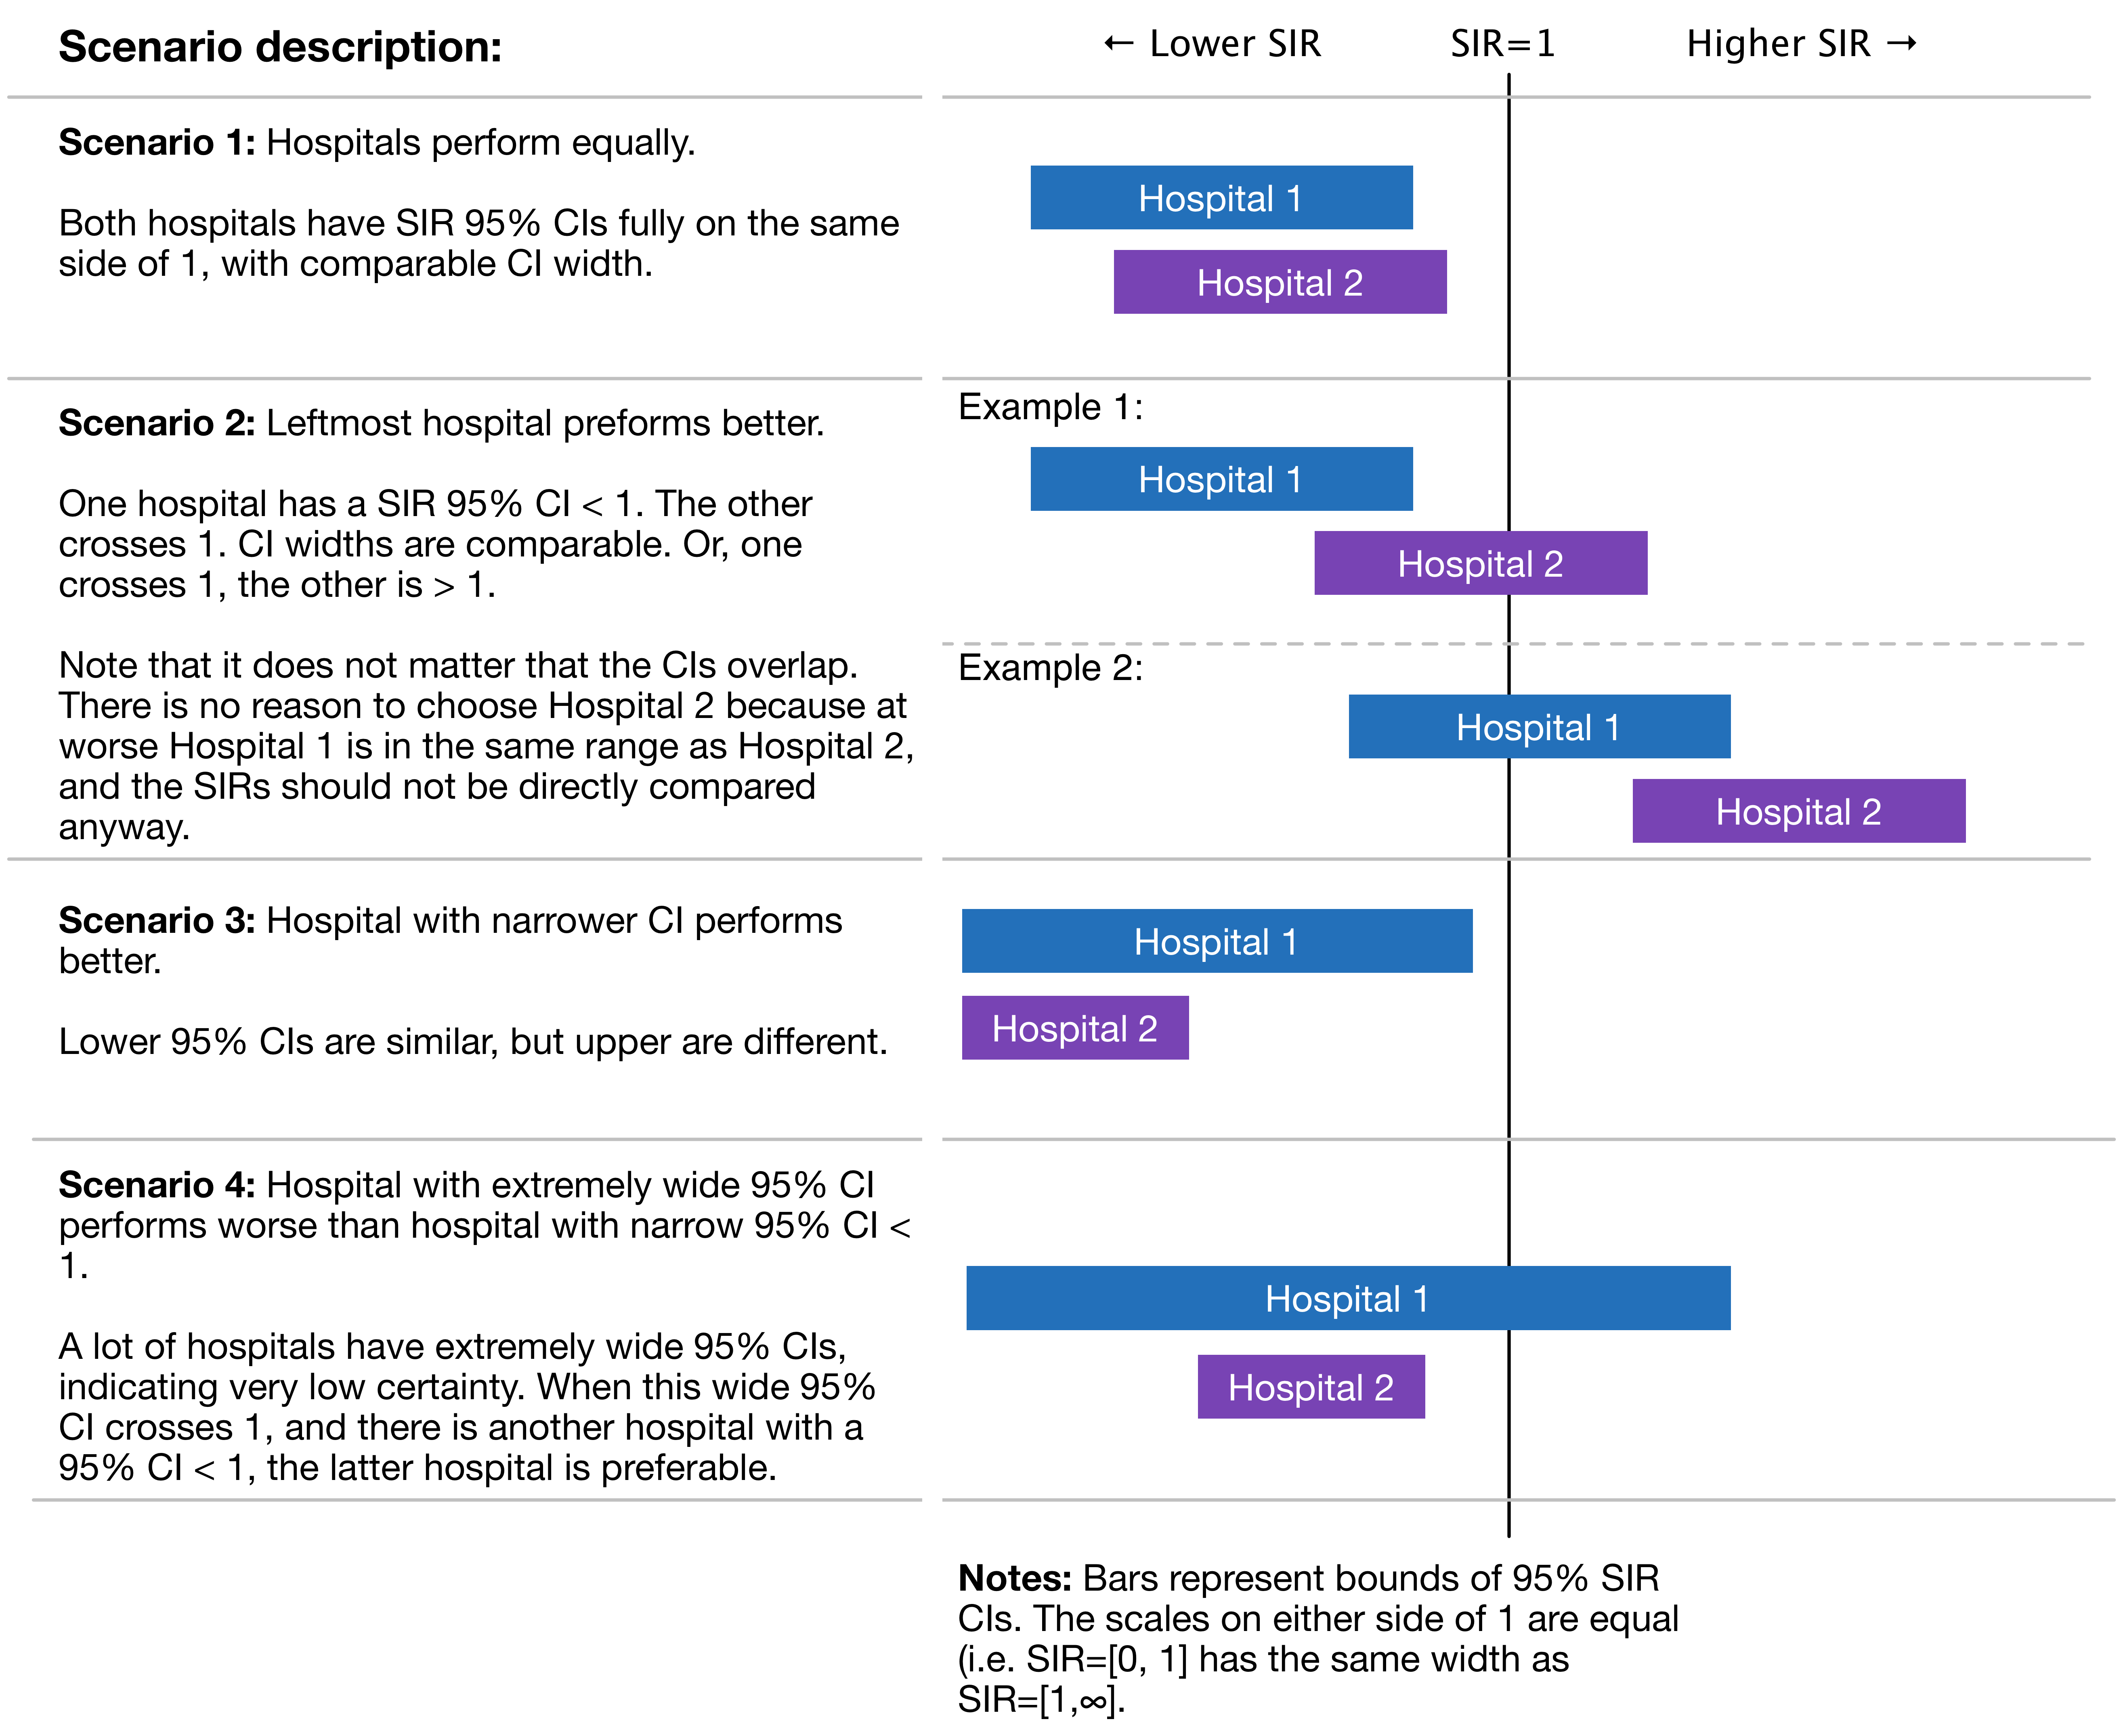
Questions are divided into 4 scenarios of 3 questions each:

Questions are in order from 1 to 12 below, so questions in the same scenario are grouped together. In the actual survey administered to patients, they were shuffled into the following order for all respondents:
Question 8
Question 11
Question 2
Question 4
Question 5
Question 10
Question 9
Question 3
Question 12
Question 7
Question 6
Question 1
About the new presentation method
The new presentation method uses "dot ratings" to describe the performance of a hospital:
| Infection dot rating | Description |
|---|---|
| ●○○○ | 95% upper CI < 1; SIR point estimate < 0.42 (this is 1 SD for CAUTIs in the CMS Hospital Compare data) |
| ●●○○○ | 95% upper CI < 1; SIR point estimate between 0.42 and 1 |
| ●●●○○ | 95% upper CI > 1; SIR point estimate < 1 |
| ●●●●○ | 95% upper CI > 1; SIR point estimate between 1 and 2.4 (1 SD) |
| ●●●●● | 95% upper CI > 1; SIR point estimate > 2.4 (1 SD) |
| Confidence dot rating | Description |
|---|---|
| High | High confidence: 1/2 of IQR or smaller; IQR = 6.63 for SIR 95% CI width for CAUTI |
| Moderate | Moderate confidence: Between 1/2 IQR and 1 IQR |
| Low | Low confidence: > 1 IQR |